 cord
cordThe State of UK Tech Hiring: Summer 2026
Ben Henley · September 8, 2026
cord is the largest job search for engineers in the UK. Every quarter, cord publishes its proprietary platform data and ranks every tech company to identify the most popular with engineers and the fastest growing. This report pulls all of that analysis together into an overall picture of the state of UK tech hiring for Summer 2026.
TL;DR
AI is reshaping hiring in profound ways, and this summer it broke out. It shows up on both sides of the data. AI companies took over the growth rankings outright, and AI-generated applications are flooding the channels where engineers and employers meet, changing what it takes to get noticed and to hire.
Five things have stood out this summer.
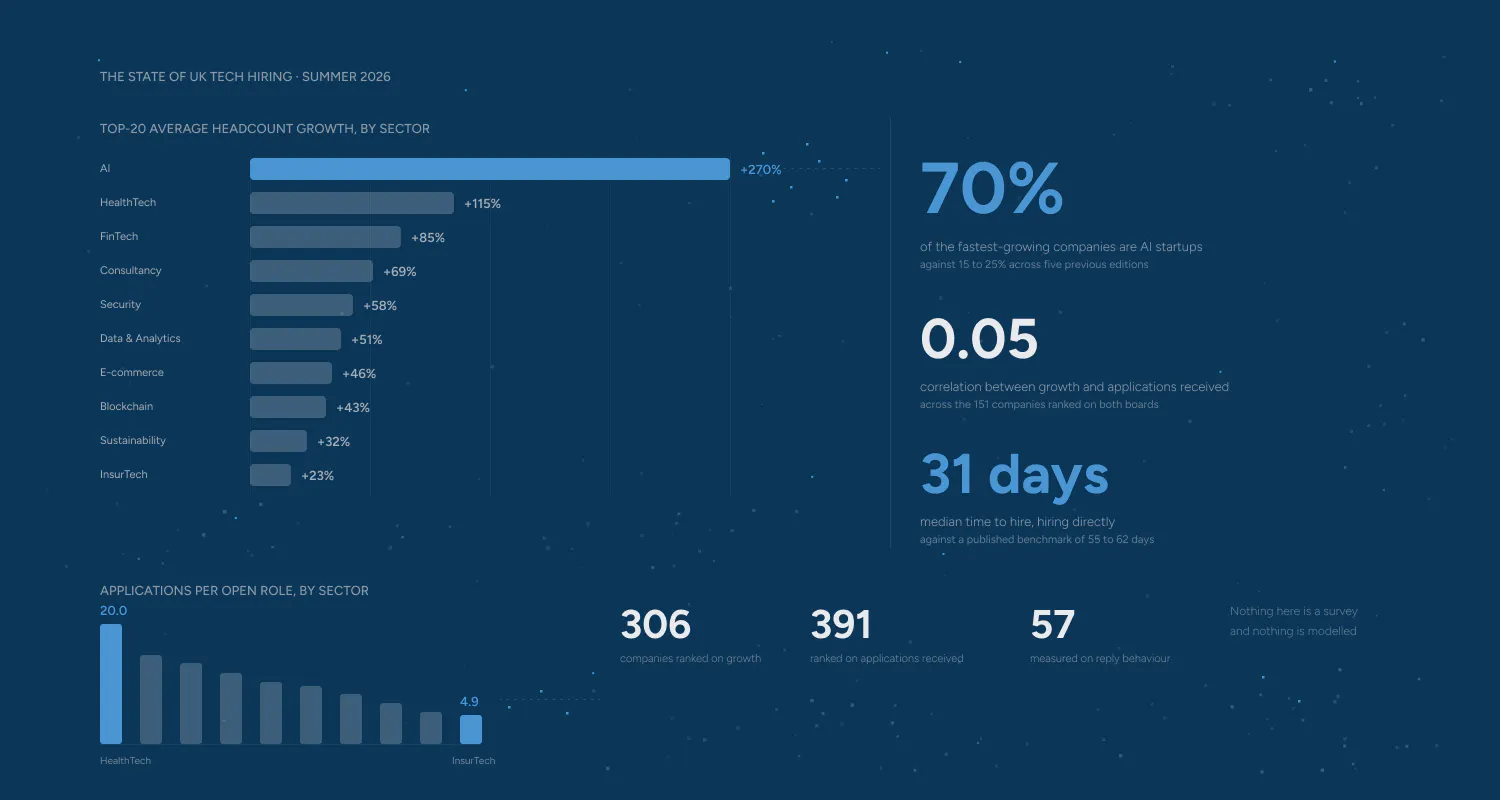
- AI has completely taken over the growth rankings. 70% of the fastest-growing companies are AI startups, against 15 to 25% across the five previous editions. AI's twenty fastest growers averaged +270% headcount growth. The next sector managed +115%.
- The odds of getting hired vary fourfold by sector. HealthTech runs at 20 applications per open role. InsurTech runs at 4.9. A national average tells you almost nothing about your own hire, on either side of the table.
- Growing fast earns a company almost no attention. Across the 151 companies measured on both boards, the correlation between growth and applications received is 0.05. The companies hiring hardest are largely invisible to the engineers they want.
- Replying fast is the cheapest advantage in hiring, and small teams are winning with it. Six of the 57 companies measured answered every single person who applied, and the fastest first reply came from a 16-person company inside seven hours. Reply rates barely move with application volume (r = 0.02), so this is an edge open to any team, at any size, without spending a pound.
- Hiring an engineer takes a month, if the communication is direct. Median time to hire on cord is 31 days against a published norm of 55 to 62 for technical roles, and it has got quicker four years running. Part of that, we think, is that direct communication cuts through a market now flooded with AI-generated applications and automated sourcing tools.
How the numbers are made
Nothing here is a survey and nothing is modelled. These rankings count what companies did: how much they grew, how many engineers applied to them, and whether anyone replied. Every company named can be looked up and checked on cord's live rankings, rebuilt each quarter and published in full.
- Growth: 306 companies, ranked by percentage headcount change over twelve months, from public records.
- Demand: 391 companies, ranked by applications received for technical roles.
- Reply behaviour: the 57 companies hiring directly through cord.
Every measure is split by headcount into small, medium and large, so a 16-person team is compared with its peers rather than with a bank.
These are leaderboards, not sector averages. "AI's twenty fastest growers averaged +270%" is the average of twenty exceptional companies, not the sector rate. And headcount is whole-company, not engineering: public records count everyone a business employs.
01 · AI has taken over the growth rankings
The twenty fastest-growing companies in UK tech
Every one at least doubled its headcount. 13 of the 20 tripled or better, against a median of 33% across all 306 companies measured. Voy leads the country, from roughly 27 people to 448.
Ranked by percentage headcount growth over twelve months. Location and sector as published on cord.
- 01. Voy — London · HealthTech — +1,544% to 448 people
- 02. Seamflow — London · AI/ML — +800% to 19 people
- 03. Genuit Group — Leeds · Construction — +793% to 1,100 people
- 04. Kodamai — Glasgow · AI/ML — +667% to 25 people
- 05. Nscale — UK · Cloud & Infrastructure — +487% to 914 people
- 06. Crimson — London · LegalTech — +467% to 35 people
- 07. Conduct — London · AI/ML — +375% to 62 people
- 08. Isembard — London · Manufacturing — +333% to 55 people
- 09. Voop — London · Internet — +300% to 16 people
- 10. Dwelly — London · PropertyTech — +281% to 87 people
- 11. Tano — London · AI/ML — +280% to 19 people
- 12. Granola — London · AI/ML — +224% to 146 people
- 13. Wireless Logic — Berkshire · Telecomms — +211% to 886 people
- 14. Zango — London · AI/ML — +190% to 29 people
- 15. Fuse — London · Energy & Utilities — +186% to 414 people
- 16. Elyos AI — London · AI/ML — +185% to 41 people
- 17. Letly — London · PropertyTech — +180% to 18 people
- 18. Oxford Dynamics — Oxfordshire · Robotics — +157% to 40 people
- 19. Artificial Societies — London · AI/ML — +157% to 22 people
- 20. Prolific — London · AI/ML — +147% to 1,455 people
View the full fastest-growing leaderboard on cord
Nine of the twenty are AI companies; fifteen are in London. Nine in twenty is smaller than AI's 70% share of the full board because a top twenty is the extreme tail. The wider the cut, the more of it is AI.
Which industries are scaling hardest?
AI's twenty fastest growers averaged +270%. The next sector managed +115%. The gap between first and second is wider than the gap between second and tenth.
- AI — +270% top-20 average growth, led by Seamflow on +800%, 78 companies ranked
- HealthTech — +115%, led by Voy on +1,544%, 71 companies ranked
- FinTech — +85%, led by Monzo on +142%, 95 companies ranked
- Consultancy — +69%, led by Attercop on +133%, 98 companies ranked
- Security — +58%, led by Voop on +300%, 59 companies ranked
- Data & Analytics — +51%, led by GoodFit on +138%, 70 companies ranked
- E-commerce — +46%, led by NOLO on +113%, 56 companies ranked
- Blockchain (thin) — +43%, led by Plasma on +131%, 12 companies ranked
- Sustainability — +32%, led by Fuse on +186%, 37 companies ranked
- InsurTech — +23%, led by Diesta on +59%, 39 companies ranked
Blockchain fielded only 8 qualifying companies and is directional.
Why AI is different this year, not just ahead
For five editions, AI held 15 to 25% of the growth board at a median of 70 to 100% growth. This quarter both broke at once: 70% of the board now carries an AI tag.
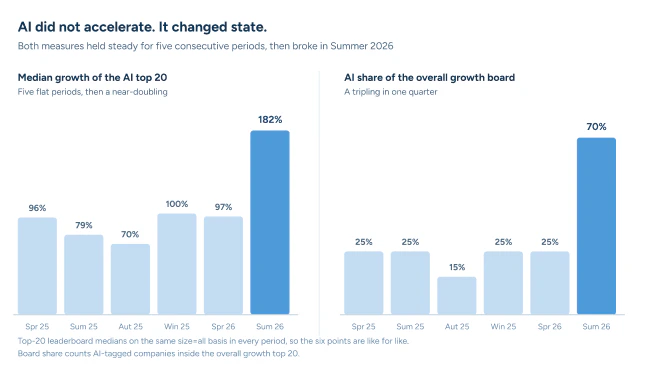
The premium holds within sector and at every size: 143% against FinTech's 50% among small companies, 74% against 40% among medium, 59% against 37% among large.
The two sectors with no AI presence, InsurTech and Security, are also the two slowest-growing, at 18% and 35%. Not proof of cause, but a headcount plan built on the market as a whole will overstate what is available outside the sectors AI has reached.
One catch: the AI large-company board returns eight names against FinTech's twenty, and Nscale (914 people) is the only at-scale AI growth story in the index. The sector doing most of the hiring is almost entirely small companies, competing for senior people on the work itself and on speed rather than scale or brand.
Growth by company size
Small companies post the wildest percentages off the smallest bases, so each size band gets its own list. But hyper-growth is not only a startup story: Genuit Group nine-folded to 1,100 people, and Monzo, a 5,807-person bank, still managed 142%.
Small companies, average +230%
- Seamflow +800%
- Kodamai +667%
- Crimson +467%
- Voop +300%
- Tano +280%
- Zango +190%
- Elyos AI +185%
- Letly +180%
Medium companies, average +222%
- Voy +1,544%
- Conduct +375%
- Isembard +333%
- Dwelly +281%
- Granola +224%
- Fuse +186%
- Plasma +131%
- Fractile +125%
Large companies, average +132%
- Genuit Group +793%
- Nscale +487%
- Wireless Logic +211%
- Prolific +147%
- Monzo Bank +142%
- Graphcore +90%
- Smart Working +76%
- Wayve +64%
Medians: small +152%, medium +120%, large +59%.
02 · Your sector sets your odds
Applications per open role, across each sector's twenty most applied-to companies. HealthTech runs four times the competition of InsurTech, with the fewest openings of any sector.
- HealthTech — 20.0 applications per role (2,218 applications, 111 open roles)
- AI — 14.8 (3,034 applications, 205 open roles)
- Blockchain (thin) — 13.5 (579 applications, 43 open roles)
- Consultancy — 11.8 (4,421 applications, 375 open roles)
- E-commerce — 10.4 (1,587 applications, 153 open roles)
- Data & Analytics — 9.6 (3,088 applications, 323 open roles)
- FinTech — 8.3 (6,242 applications, 750 open roles)
- Sustainability — 6.8 (1,224 applications, 179 open roles)
- Security — 5.4 (1,917 applications, 355 open roles)
- InsurTech — 4.9 (2,945 applications, 605 open roles)
FinTech is the volume engine on both sides: the most applications and the most open roles.
The regional picture: London's dominance is almost entirely financial services. Security is 57% non-London (the Cheltenham and Bristol axes), Sustainability 43% (Belfast, Exeter, Lincolnshire), FinTech 5%, Blockchain zero. The fastest-responding company in the country is in Preston; the second is in Chipping Norton.
03 · Growing fast earns almost no attention
The twenty most applied-to companies
Twenty employers in the top 2% by application volume. Nineteen are in London, and most are names you would recognise without working in tech.
- 01. Wise — London · FinTech — 1,170 applications, top 1%
- 02. Speechify — London · App Development — 759 applications, top 1%
- 03. JUXT — London · FinTech — 633 applications, top 1%
- 04. RELX — London · Data — 615 applications, top 1%
- 05. Lloyds Banking Group — London · Banking — 483 applications, top 1%
- 06. CGI — London · Consultancy — 396 applications, top 1%
- 07. Kraken Technologies — London · EnviroTech — 393 applications, top 1%
- 08. G-Research — London · Investment — 363 applications, top 1%
- 09. Aon — London · Insurance — 357 applications, top 1%
- 10. Experimentation Elite — London · Events — 345 applications, top 1%
- 11. Bauer Media Outdoor — London · Marketing — 341 applications, top 1%
- 12. Abtrace — London · HealthTech — 319 applications, top 1%
- 13. Inspired Thinking Group — London · Marketing — 318 applications, top 1%
- 14. Barclays — London · Finance — 315 applications, top 1%
- 15. Checkout.com — London · FinTech — 303 applications, top 1%
- 16. Plentific — London · PropertyTech — 301 applications, top 1%
- 17. LSEG — London · Finance — 291 applications, top 1%
- 18. Aviva — London · Insurance — 273 applications, top 1%
- 19. Compare the Market — London · FinTech — 261 applications, top 2%
- 20. Lead Forensics — Portsmouth · Software — 260 applications, top 2%
View the full most-popular leaderboard on cord
Not one company from the growth list appears here. Applying to Wise means a queue of 1,170 at a company hiring at ordinary speed; a company on the growth list has just doubled its team and has almost no queue. For a fast-growing employer absent from this list, the hiring process is not the problem. Nobody knows the roles exist, and that is fixed by going to engineers directly.
What actually drives applications?
Recognition, almost entirely. Across the 151 companies on both boards, the correlation between growth and applications is 0.05. Split into four groups by growth rate, median applications run 57, 48, 69 and 66.
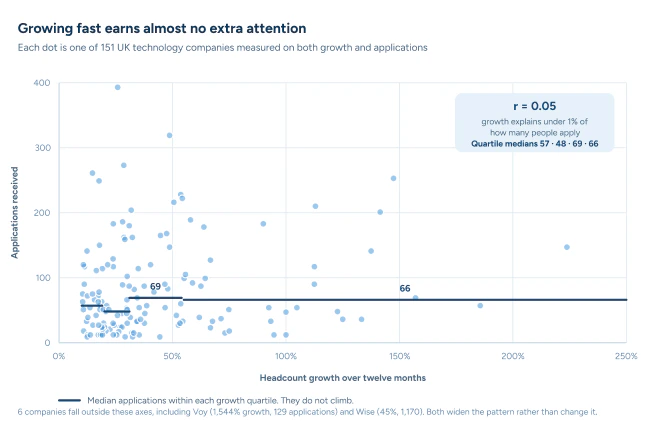
Size moves the number only weakly: the smallest quarter of companies (median 31 people) drew 42 applications, the largest quarter (median 2,178) drew 99. Seventy times bigger, twice the attention.
- Small — median 129 applications across the top 20, led by Experimentation Elite on 345
- Medium — median 213, led by Speechify on 759
- Large — median 309, led by Wise on 1,170
The two extremes. Growing fast, barely noticed:
- Attercop — +133% growth, 36 applications
- Fractile — +125% growth, 36 applications
- Tracelight — +100% growth, 12 applications
- Amodo Design — +95% growth, 12 applications
- Healf — +73% growth, 15 applications
Barely growing, heavily applied to:
- Kraken Technologies — +26% growth, 393 applications
- Compare the Market — +15% growth, 261 applications
- Kainos — +18% growth, 249 applications
- Person Centred Software — +18% growth, 150 applications
- NEC Software Solutions — +12% growth, 141 applications
Which industries are over and under-attended?
InsurTech gets eight times more attention per point of growth than AI. In absolute terms FinTech is the clearest magnet, at a median of 226 applications per top-20 company.
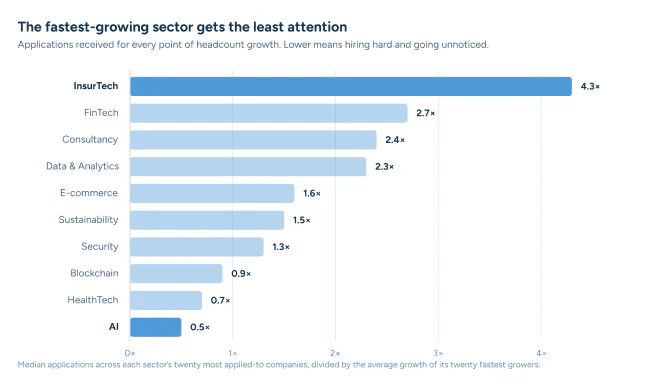
- FinTech — median 226 applications, most applied-to Wise on 1,170
- Consultancy — median 170, most applied-to JUXT on 633
- AI — median 144, most applied-to Prolific on 253
- Data & Analytics — median 116, most applied-to RELX on 615
- InsurTech — median 99, most applied-to Lloyds Banking Group on 483
- Security — median 77, most applied-to Atos on 234
- HealthTech — median 77, most applied-to Abtrace on 319
- E-commerce — median 74, most applied-to loveholidays on 138
- Sustainability — median 48, most applied-to Kraken Technologies on 393
- Blockchain (thin) — median 39, most applied-to Elliptic on 216
Cut by sector, most markets are reasonably aligned: nine InsurTech companies appear on both the growth and demand boards, eight in Sustainability, six each in HealthTech and Security. Consultancy is the exception, with zero overlap: applications pile into CGI, Aon and Kainos while the growth sits at firms of 15 to 40 people.
Attention in UK tech is a stock built up over years, not a signal of where the hiring is now.
04 · Replying fast is the cheapest advantage in hiring
Reply behaviour is only measurable where the conversation happens somewhere it can be counted, which is why almost nobody publishes it. Across the 57 companies where it can, six answered every single applicant, and the fastest is a 16-person healthcare company that beats every bank on the demand list.
Highest response rate
- 01. Ufonia — 100%
- 02. VoCoVo — 100%
- 03. Lunio — 100%
- 04. Longshot Systems — 100%
- 05. Blueco Healthcare — 100%
- 06. Dunelm — 100%
- 07. Plentific — 99.7%
- 08. Thought Machine — 99.4%
- 09. mOOvIQ — 98.7%
- 10. Applied Data Science Partners — 98.6%
Fastest to reply
- 01. Blueco Healthcare — median first reply 6.9 hrs
- 02. VoCoVo — 8.4 hrs
- 03. Longshot Systems — 11.0 hrs
- 04. Muzz — 14.8 hrs
- 05. TransFICC — 18.4 hrs
- 06. Dunelm — 19.2 hrs
- 07. Searchland — 20.8 hrs
- 08. Stateful Robotics — 21.1 hrs
- 09. TimeTraceLabs — 24.6 hrs
- 10. Circuit Mind — 26.2 hrs
Every company in the top 20 answered at least 94% of applicants. Eight of the top ten reply inside a single working day. The full Hiring Leaders awards are on cord.
Volume is no barrier. The correlation between applications received and reply rate is r = 0.02, and JUXT replies to 94% of its 633 applications. Nothing about scale or workload stands between a hiring team and the top of this board.
Small companies reply fastest, and it runs opposite to where the applications go:
- Small — median reply 2.2 days, median 44 applications, fastest Blueco on 6.9 hrs
- Medium — median reply 2.5 days, median 112 applications, fastest VoCoVo on 8.4 hrs
- Large — median reply 3.2 days, median 162 applications, fastest Dunelm on 19.2 hrs
Dunelm, the best large employer at 19.2 hours, would place only sixth overall, and just three of the twenty fastest employ more than 500 people. For a small company, speed is the clearest edge on offer over everyone above it.
Which companies do all three things well?
Twelve companies grew fast, attracted applications and answered them. Mid-sized, largely unglamorous, and the closest thing this report has to a list of well-run employers: Abtrace, Advai, Applied Data Science Partners, Flok Health, Fundment, Oneiro Solutions, Opencast, PortSwigger, Prolific, Risk Ledger, TwinStream and Xantura.
Twelve of the 57 companies eligible for all three measures.
05 · A month is enough, when the communication is direct
- Time from first contact to a confirmed hire — 31 days on cord, against a published benchmark of 55 to 62 days (SHRM and 2026 industry reports)
- Engineers replying to a direct, personal approach — 40 to 52% on cord, against 18 to 25% (LinkedIn recruiting InMail)
Both benchmarks are for technical roles. Time to hire is the median across confirmed hires; the outreach figure counts positive replies to a first message.
A direct hire takes roughly half as long as the industry expects, and engineers answer a direct approach about half the time, against a fifth for a cold InMail.
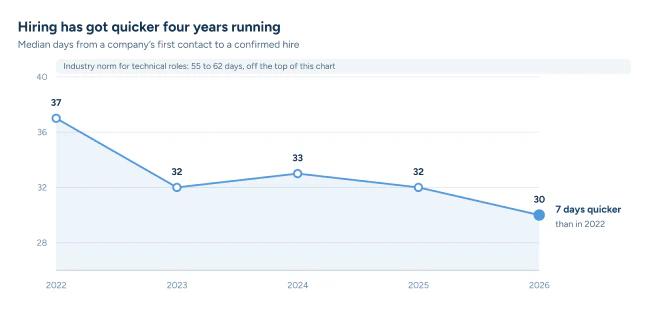
It is also getting quicker: from 37 days in 2022 to 30 so far in 2026. Part of that, we think, is the noise. Application channels are flooded with AI-generated applications and automated sourcing tools, and the more noise in those channels, the more a direct, personal conversation stands out and moves quickly.
Pay held steady. Advertised bands run £60,000 to £95,000 depending on the skill, and IT Jobs Watch's independently tracked median sits inside cord's band on almost every skill.
The one that surprises people. Publishing the salary barely moves engagement: 64% of UK roles show a band, and engagement is near-identical whether pay is shown (40.1%) or hidden (40.9%).
About one application in five reaches a live conversation. The rest end in rejection or silence, and which of the two varies enormously between employers (see section 04).
Concluding thoughts
AI is reshaping hiring in profound ways, and this summer it has truly broken out.
It broke out in growth first. AI is growing fastest by a long way: 70% of the growth board, with its twenty fastest growers averaging +270% against the next sector's +115%. Whoever you are hiring, you are now hiring against AI companies.
The odds of getting hired vary hugely between sectors. HealthTech runs at 20 applications per open role, InsurTech at 4.9, so a national average tells you almost nothing about your own hire.
And growing fastest does not make a company the most popular. Applications follow recognition, not growth (a correlation of 0.05), and recognition is a stock built up over years. The companies hiring hardest this summer are the ones engineers have not heard of yet.
For employers below the recognition threshold, responsiveness is the best way to stand out. It is not constrained by scale, budget or volume, and smaller teams this summer have shown how effective it can be.