 cord
cordTAM vs. TOM: The Complete Guide to Talent Market Sizing
How to Calculate, Benchmark, and Leverage Your Total Addressable Market for Smarter, Data-Driven Hiring Decisions
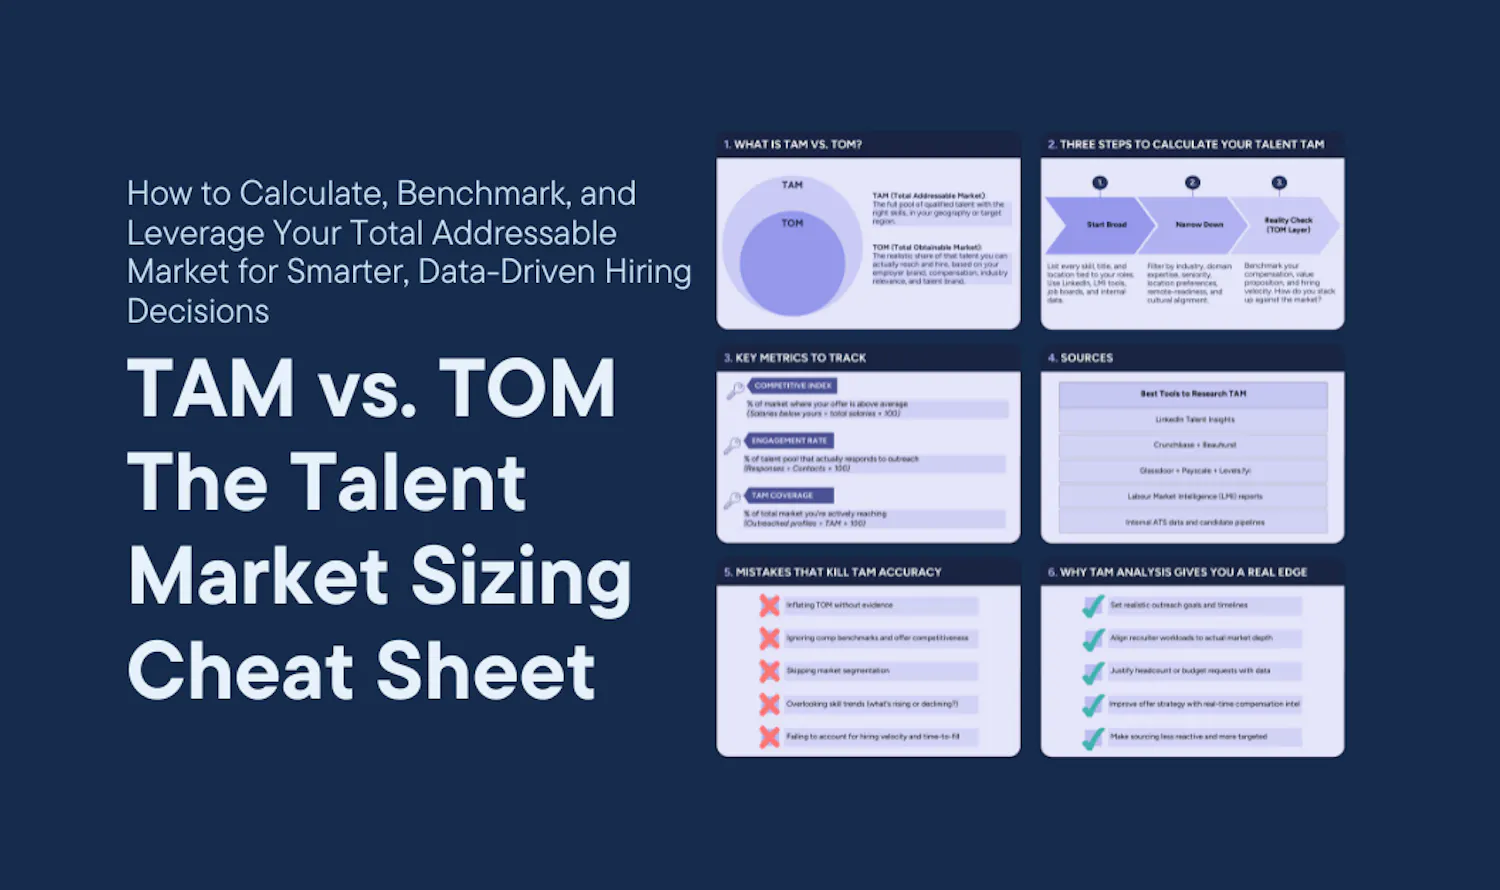
TAM analysis gives your talent acquisition team the same precision your product team uses to size markets and win them. If you don't understand your true talent market size, you're either overestimating your reach, under-planning your resources, or losing talent to better-informed competitors.
The brilliant Adriano Herdman (Move Co-Founder) put these together.
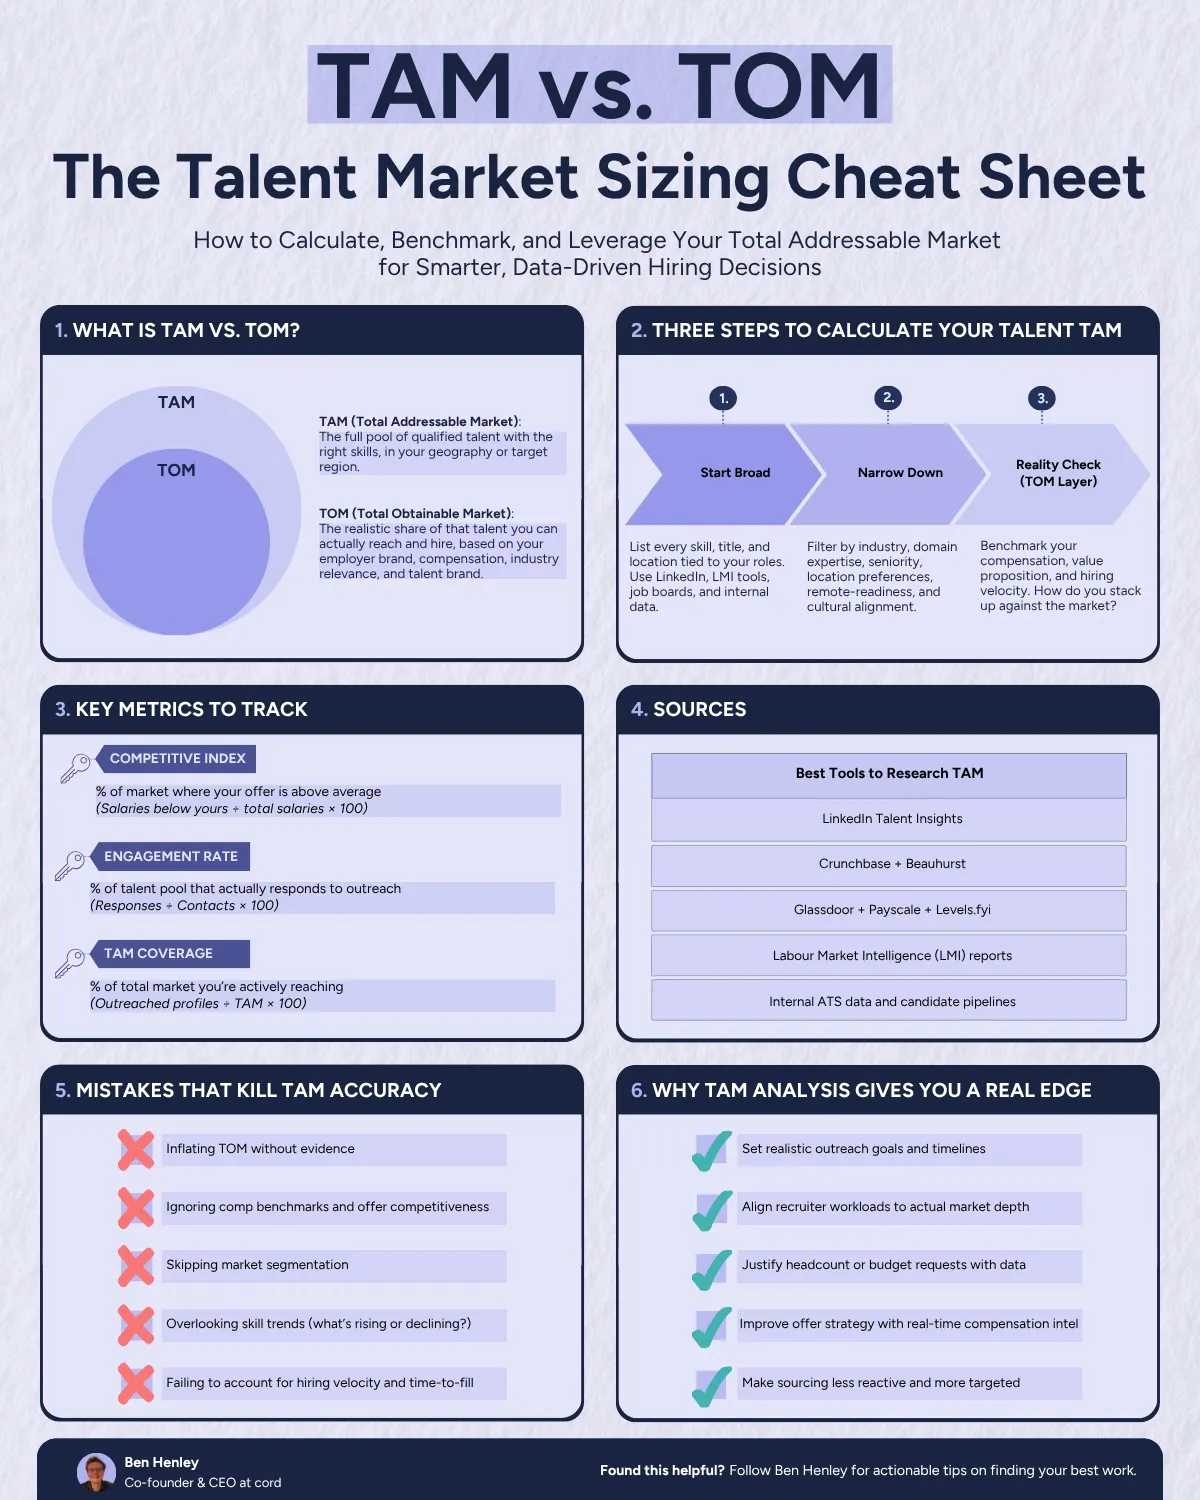
What Is TAM vs. TOM?
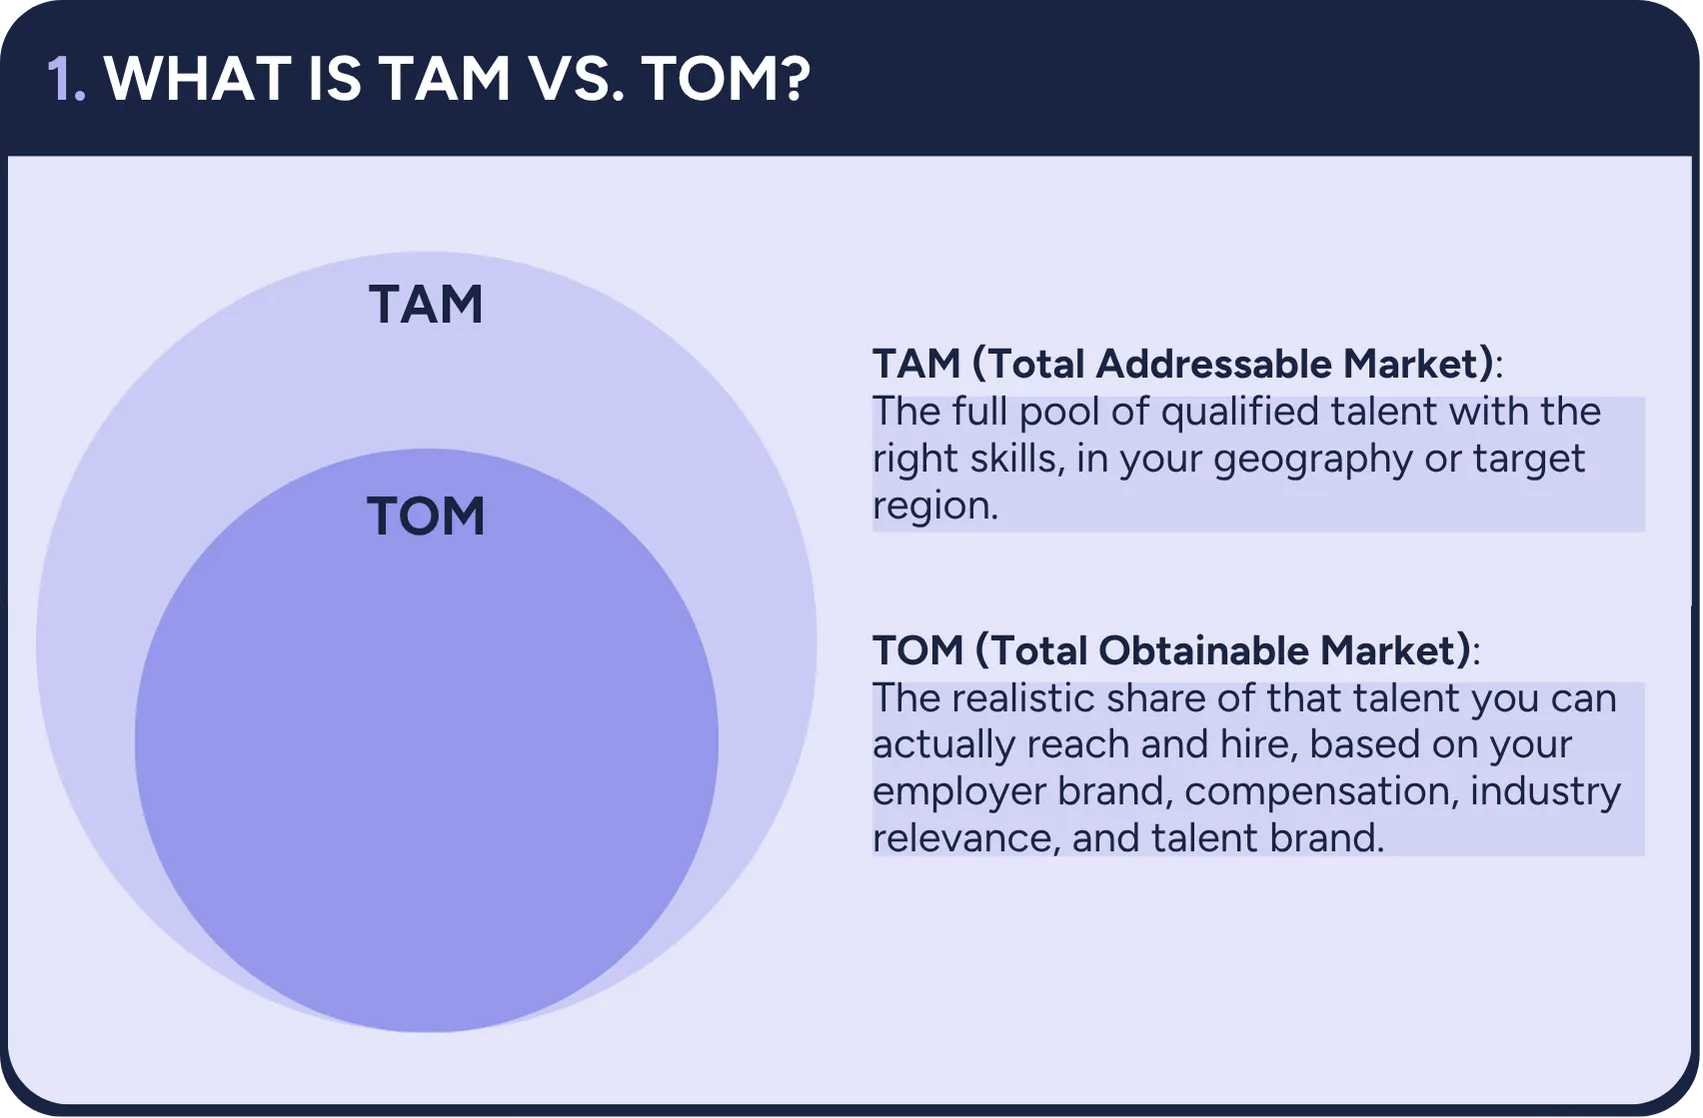
Understanding the difference between these two metrics is crucial for effective talent strategy:
TAM (Total Addressable Market): The full pool of qualified talent with the right skills, in your geography or target region.
TOM (Total Obtainable Market): The realistic share of that talent you can actually reach and hire, based on your employer brand, compensation, industry relevance, and talent brand.
Three Steps to Calculate Your Talent TAM
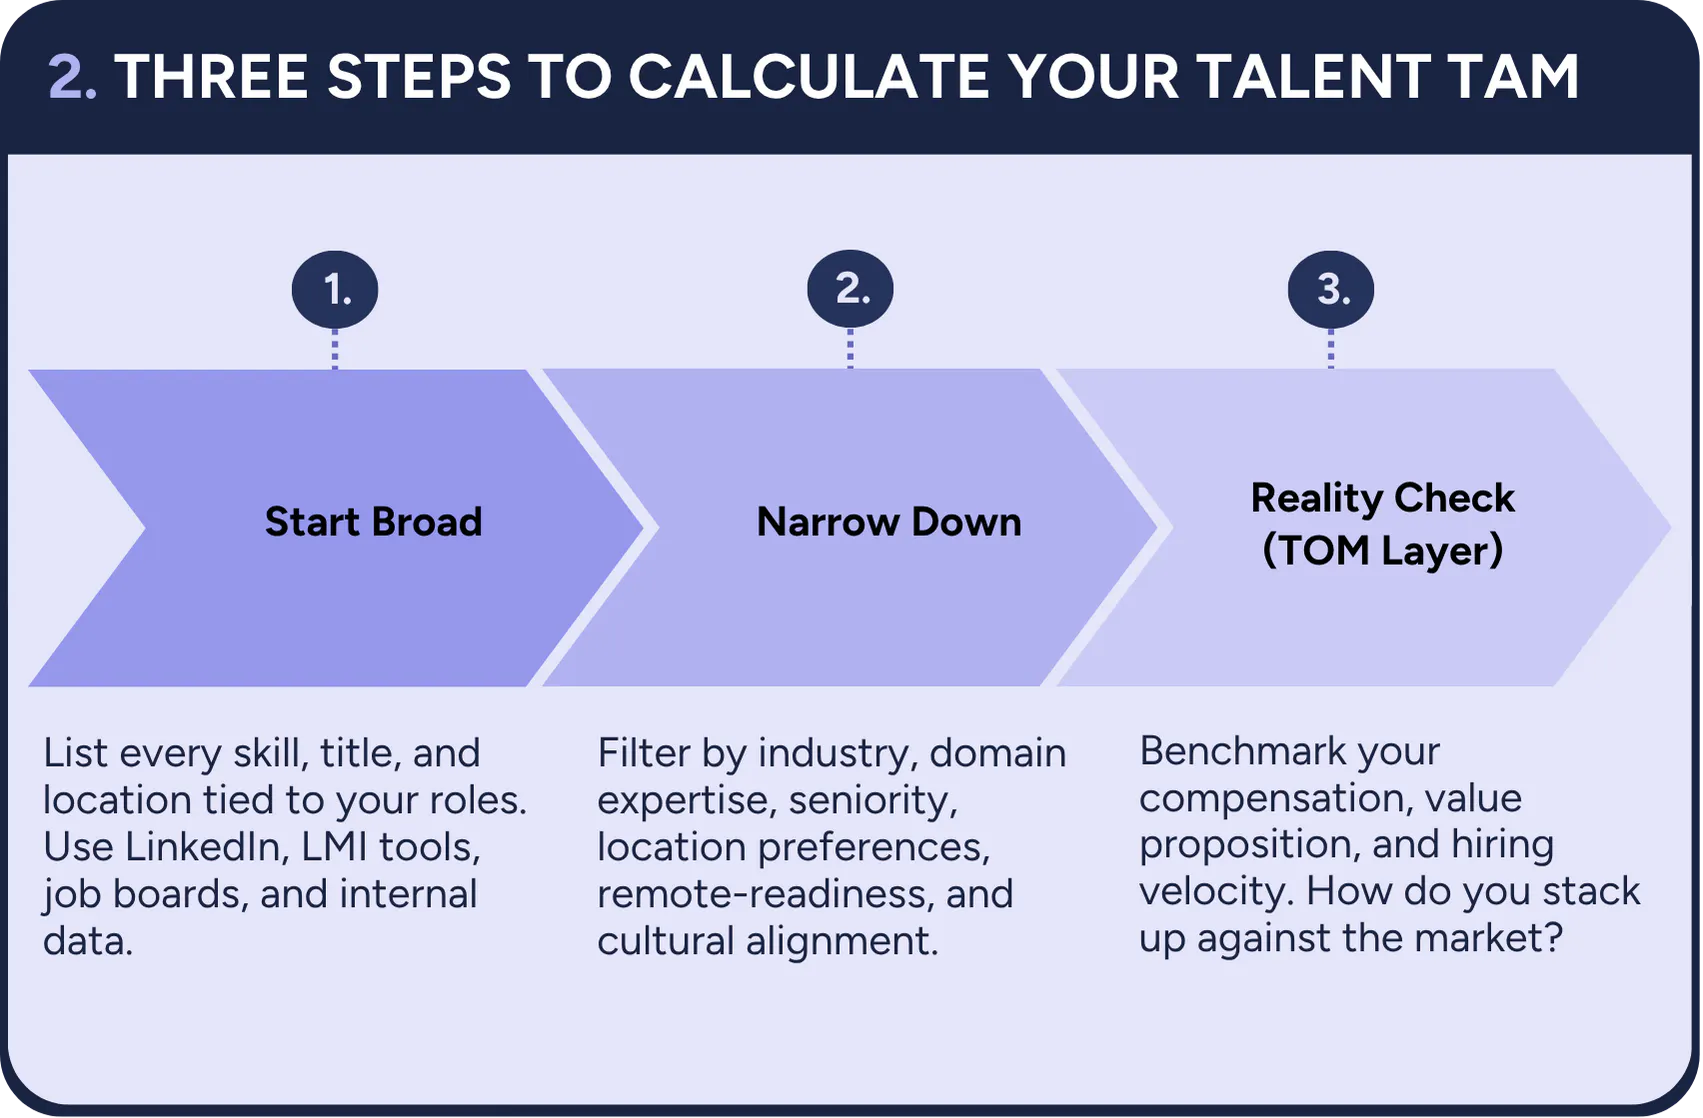
1. Start Broad
List every skill, title, and location tied to your roles. Use LinkedIn, LMI tools, job boards, and internal data to cast a wide net initially.
2. Narrow Down
Filter by industry, domain expertise, seniority, location preferences, remote-readiness, and cultural alignment. This refinement process helps you identify your actual addressable market.
3. Reality Check (TOM Layer)
Benchmark your compensation, value proposition, and hiring velocity. How do you stack up against the market? This final step determines what portion of your TAM you can realistically obtain.
Key Metrics to Track
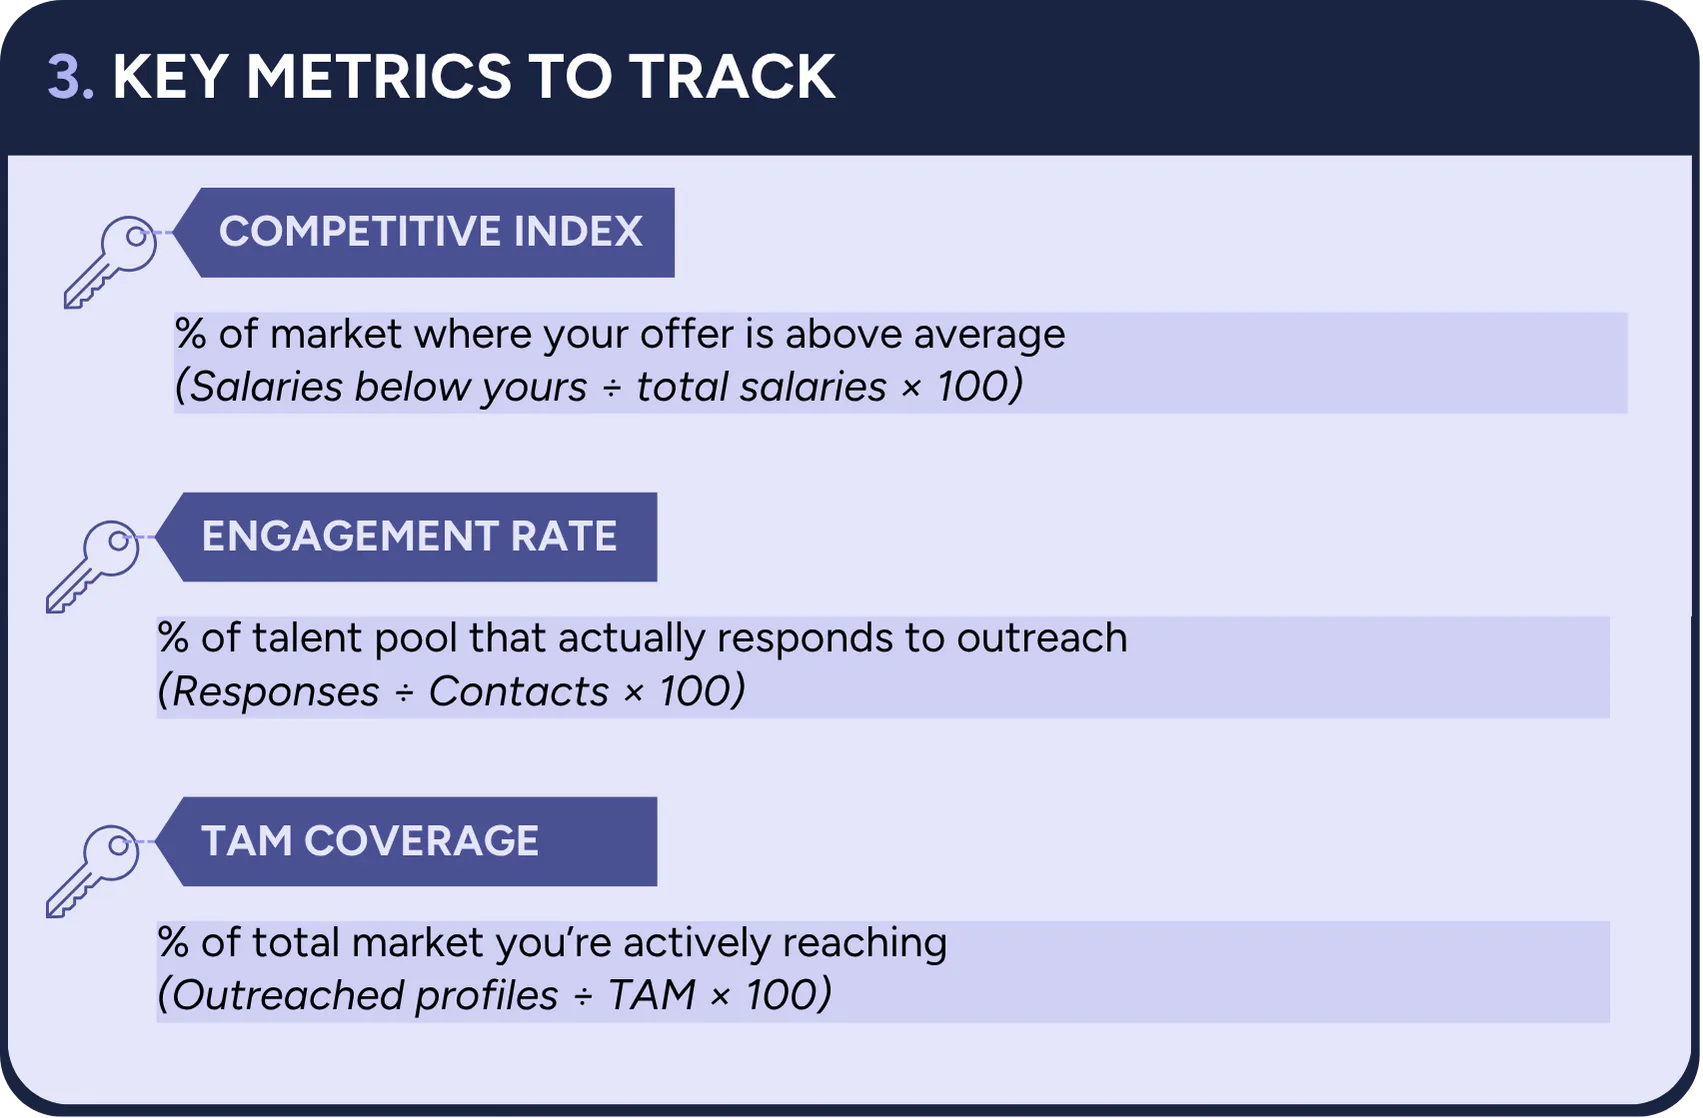
Competitive Index
Percentage of market where your offer is above average Formula: (Salaries below yours ÷ total salaries × 100)
Engagement Rate
Percentage of talent pool that actually responds to outreach Formula: (Responses ÷ Contacts × 100)
TAM Coverage
Percentage of total market you're actively reaching Formula: (Outreached profiles ÷ TAM × 100)
Best Tools to Research TAM
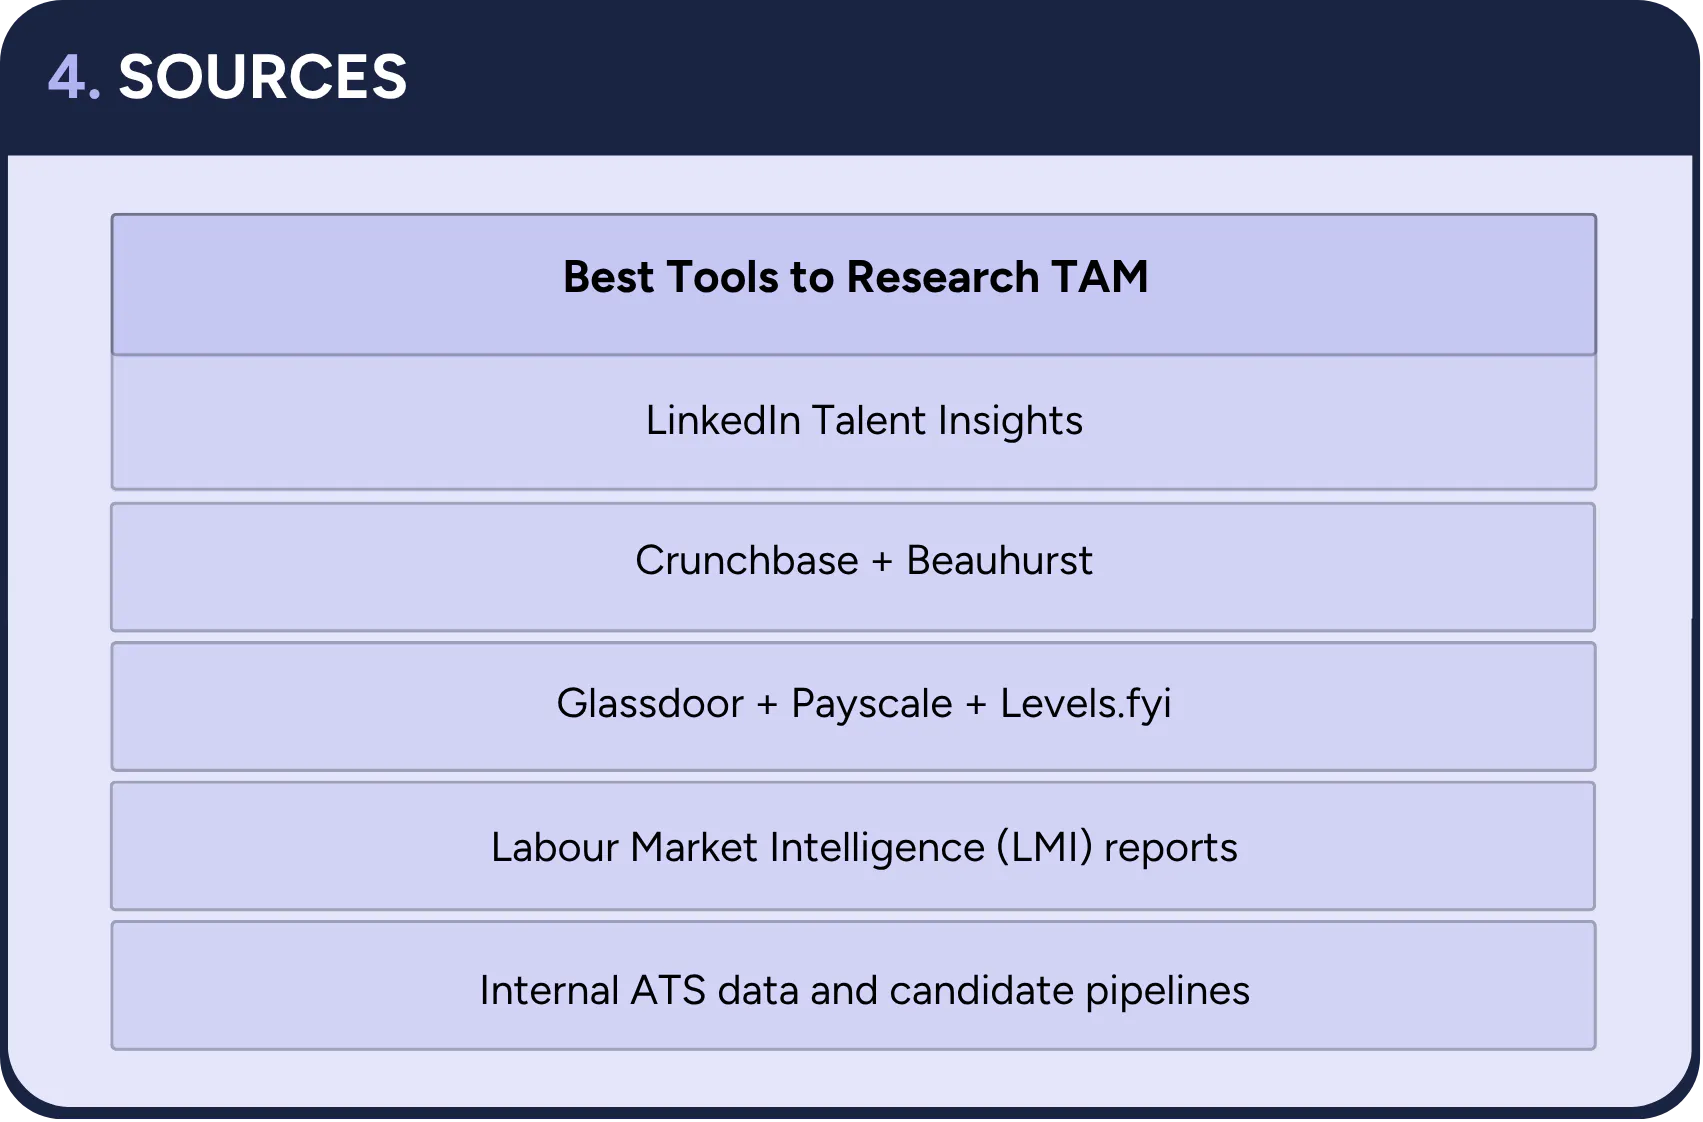
- LinkedIn Talent Insights: Comprehensive talent market data and analytics
- Crunchbase + Beauhurst: Company and market intelligence
- Glassdoor + Payscale + Levels.fyi: Compensation benchmarking
- Labour Market Intelligence (LMI) reports: Regional talent market analysis
- Internal ATS data and candidate pipelines: Historical hiring data
Common Mistakes That Kill TAM Accuracy
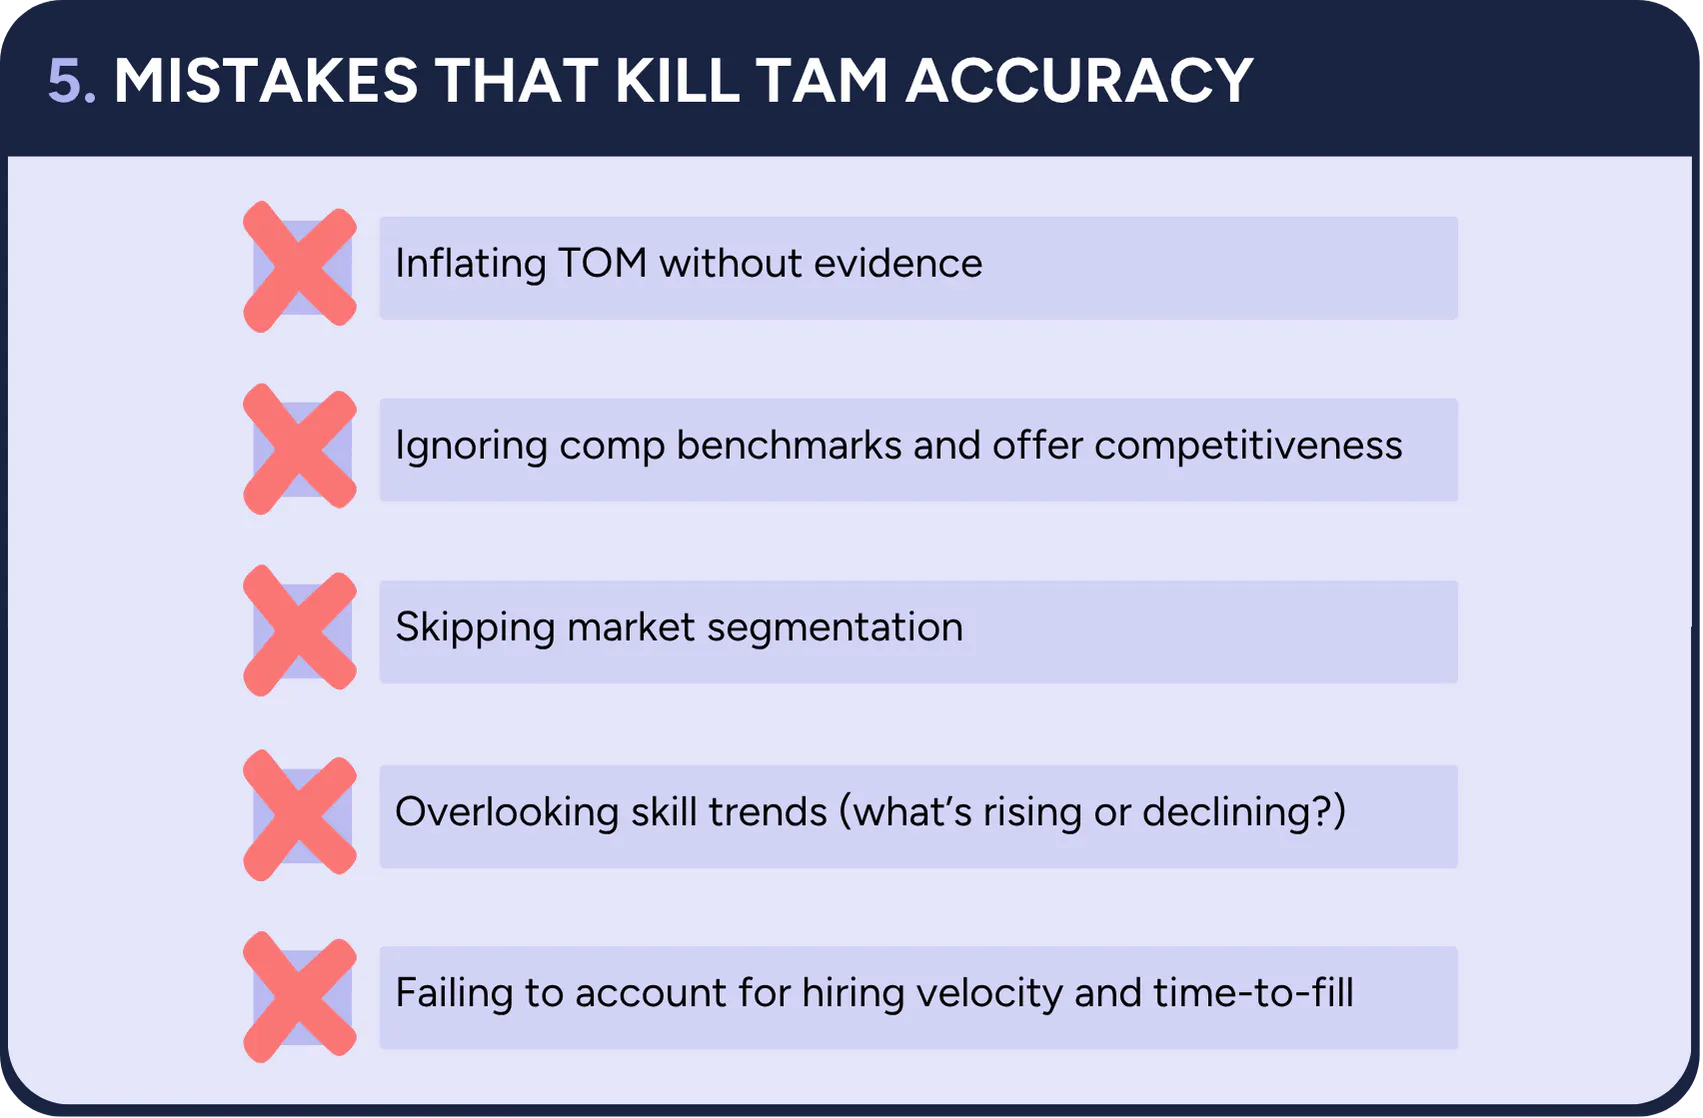
- Inflating TOM without evidence: Making assumptions about market share without data
- Ignoring comp benchmarks and offer competitiveness: Failing to assess your position against competitors
- Skipping market segmentation: Treating all talent as equivalent
- Overlooking skill trends: Missing what's rising or declining in demand
- Failing to account for hiring velocity and time-to-fill: Not considering realistic hiring timelines
Why TAM Analysis Gives You a Real Edge
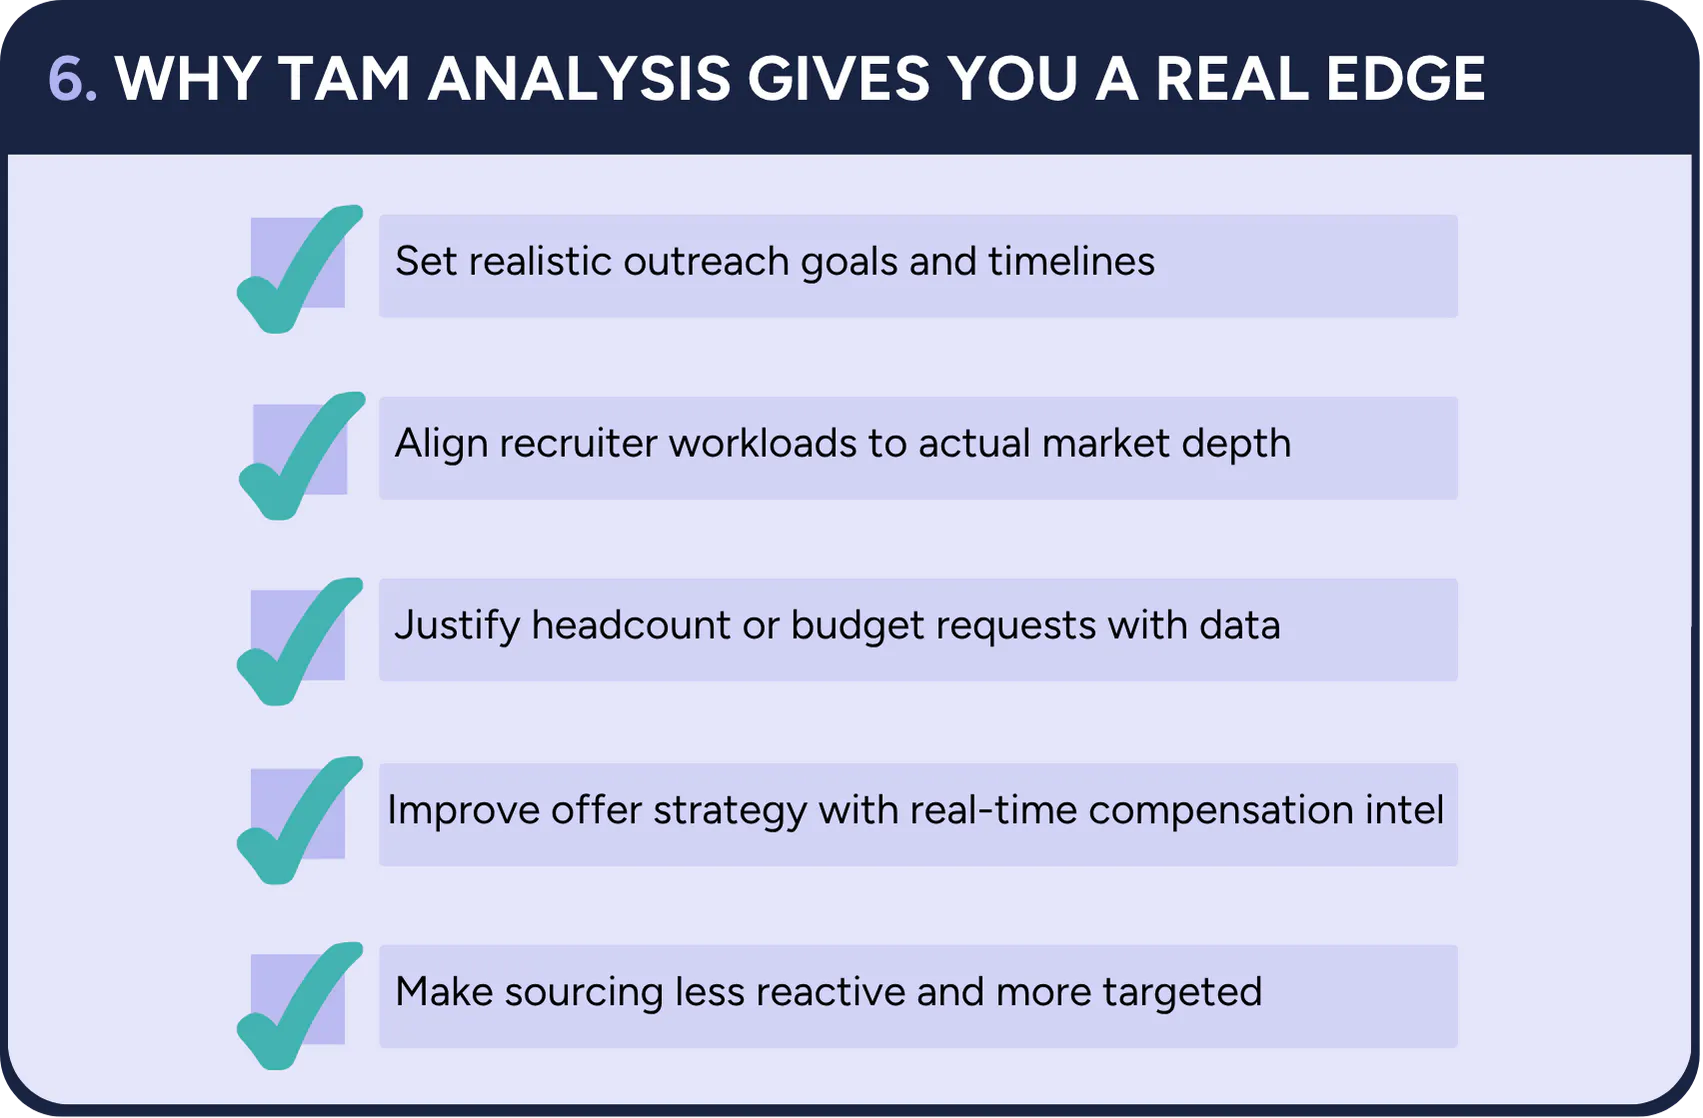
When done correctly, TAM analysis enables you to:
- Set realistic outreach goals and timelines: Base expectations on actual market size
- Align recruiter workloads to actual market depth: Distribute resources effectively
- Justify headcount or budget requests with data: Make evidence-based business cases
- Improve offer strategy with real-time compensation intel: Stay competitive in the market
- Make sourcing less reactive and more targeted: Focus efforts where they matter most
The Bottom Line
Good decisions start with clear data. Hiring is no different. Great hiring isn't luck—it's informed and intentional. By implementing TAM analysis, you transform your talent acquisition from guesswork into a strategic advantage.
Understanding your talent market size isn't just about numbers. It's about making smarter decisions that lead to better hires, faster fills, and more efficient use of your recruiting resources.

Was this content useful?